Point Forcing Source on a Half-Space

 One of my current projects is working on a method for propagating point sources within a half-space. This half space is both anisotropic and under stress or strain. The novelty of the method comes from using the equations that govern the impedance matrix. See Counter-Intuitive Results in Acousto-elasticity, where I calculate an interesting variety of surface-waves by using the magical properties of the impedance matrix.
The left figure illustrates how to calculate a surface wave front ( red), after one second, from the surface wave speed ( green). That is, the length of v is equal to the speed of the surface wave travelling in the v direction. The blue shading shows how overlapping plane waves form the wave front.
The right figure illustrates how overlapping body waves (blue) creates the resulting wave-front ( red).
One of my current projects is working on a method for propagating point sources within a half-space. This half space is both anisotropic and under stress or strain. The novelty of the method comes from using the equations that govern the impedance matrix. See Counter-Intuitive Results in Acousto-elasticity, where I calculate an interesting variety of surface-waves by using the magical properties of the impedance matrix.
The left figure illustrates how to calculate a surface wave front ( red), after one second, from the surface wave speed ( green). That is, the length of v is equal to the speed of the surface wave travelling in the v direction. The blue shading shows how overlapping plane waves form the wave front.
The right figure illustrates how overlapping body waves (blue) creates the resulting wave-front ( red).
Radially Symmetric Waves
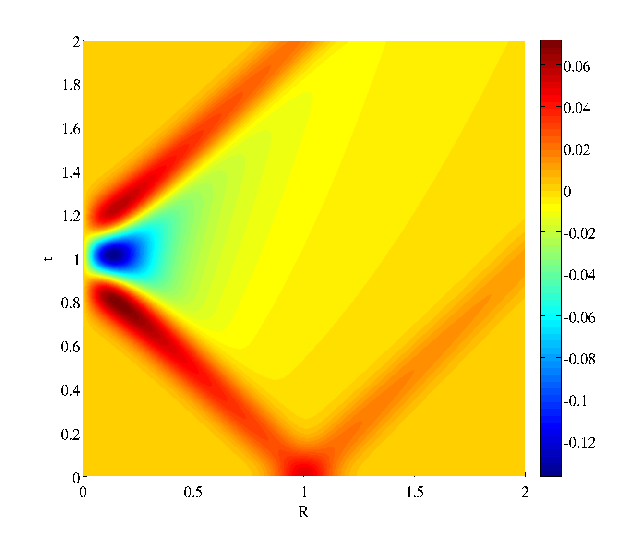
The image on the right shows the story of a wave propagting in a sphere, like a planet, travelling through both time t and space R (distance from origin).
The wave is an elastic wave with radial symmetry, so we can imagine this as a wave created from the centre of the earth. The color indicates the amplitude of the wave, with yellow-ish corresponding to no wave. In this image the wave begins at 1km from the centre of the earth, R=1, at time t=0. As time progressing, we climb up through the vertical axis, and the wave splits into two: one heading to the center of the earth of the other racing towards the surface. The wave that heads to the centre focuses its energy, as space becomes limited, and eventual "collides with the origin" and then reflects back towards the surface.
Here is a non-peer reviewed paper emphasising a qualitative understanding on the subject. It became part of my MSc dissertation.
Surface Wrinkles on Fibre-Reinforced Soft Solids
An soft elastic fibre-reinforced solid is deformed step-by-step. At each of these steps we look for a surface-wrinkle that minimizes the incremental potential energy.
When the solid is sufficiently deformed there will exist a surface-wrinkle that does not increase the potential energy. This paper shows that the wrinkles tend to align only on specific angles from the fibres.
Residually Stressed Elastic Solids


The question is how can we model the mechanical response of residually stressed solids? A new symmetry that applies to initially/residually stressed solids will help make progress on this question. See the arXiv preprint.
Determining a Train Track’s Curvature from an On-Board
Camera
To increase the number of trains running on each track we have to be able to accurately locate every train, at each moment. A method that is very promising is to use an on board camera that is mounted on top of the train and looks down at the tracks. From the image of this camera an on-board computer can locate where the train's location.
At least that is the theory. One major difficulty is that the train shakes unpredictably, which the camera sees as the track moving and changing shape unpredictably. To eliminate these errors we formulated an optimization method for each frame. This method attempts to separate the errors due to shaking from the tracks real curvature. On the right is the result of the method taking what the camera sees, the blue tracks, and returning the real position of the tracks, in red.
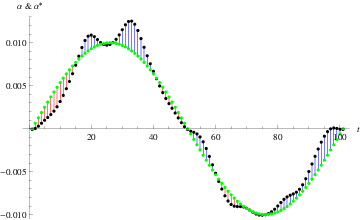
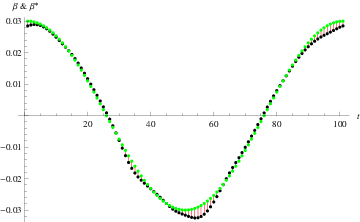
On the right we see the estimated planar curvature α and vertical curvature β, both in black, compared to the real curvatures in green.
Reconstructing a Wing from Measured Data with Geometric Faults
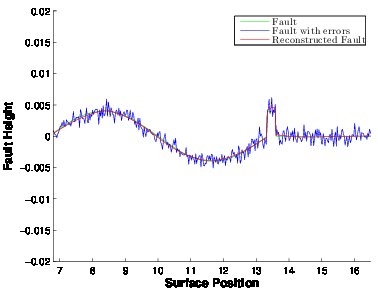
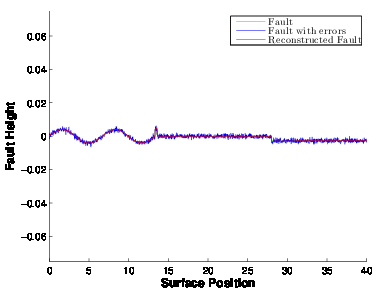
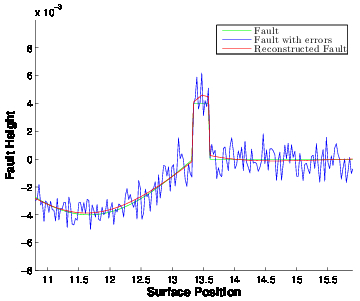
To the right is the outline of a wing with a bolt and two plates (green) that were not fitted together correctly (may require zooming in). The method I devised is given a imprecise measurement of this wing (blue) and returns an approximation of the wing (red). The method also identifies the location and type of features (i.e. the bolt and misaligned plates).
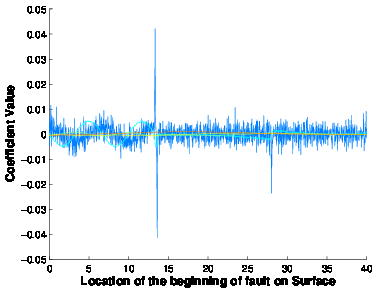
The figure on the bottom right coner (The spiky light blue image) illustrates how the method decomposes the measured data into a feature basis, much like a frequency decomposition. Details are given in my report .
