Recent observation of shear shock waves in brain
has created the need for its theoretical modeling and numerical simulation to better
understand the possiblity of formation of such waves, and thus its physiological
effects, in the event of an impact.
We have developed the state of the art theoretical model and its numerical
simulation solver describing the propagation of linearly polarized shear shock
waves in relaxing soft solids. This model and simulation has been thoroughly validated using direct
measurements of displacements in soft solids using ultrafast ultrasound
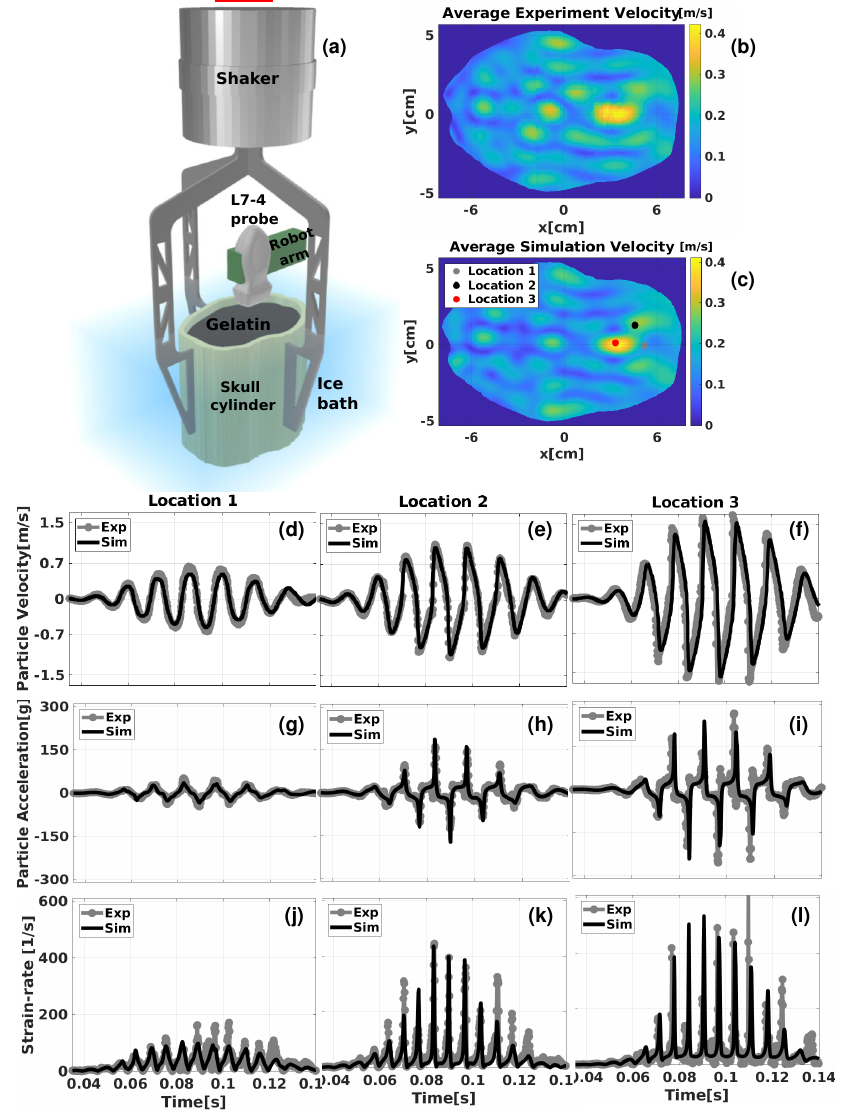
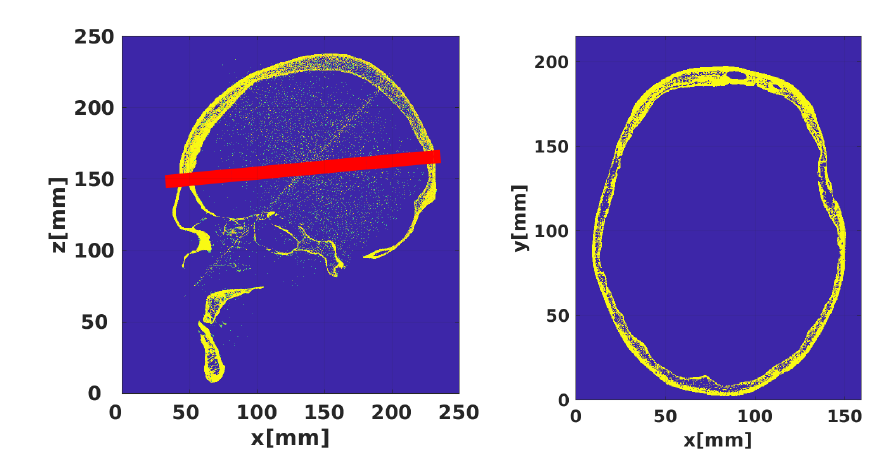
imaging. Figure 1 shows the saggital and axial section of a human head used
for constructing a human head phantom shown in Figure 2(a), attached to an
electromechanical shaker. A benign impact (with acceleration 19\(g\)) at the
surface spontaneously generates a very high local acceleration (266\(g\)) deep
inside the brain-mimicking gelatin phantom filled inside the skull phantom
due to formation of shear shocks.
Measurements of the average velocity in the gelatin and the simulation
shows a convincing match as evident from Figure 2(b,c) while demonstrating
the formation and focusing of shear shock waves caused inside the skull. The time
plots of velocity (Figure 2(d,e,f)), acceleration (Figure 2(g,h,i)),
and strain-rate (Figure 2(j,k,l)) at three different locations show an excellent
agreement between experimental measurements and simulations.
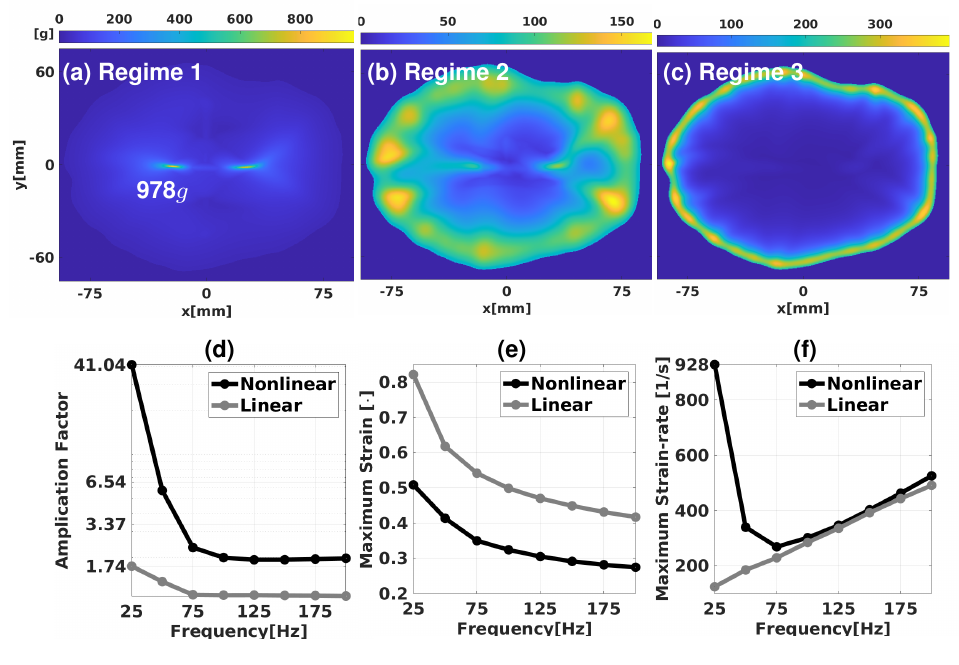
To highlight the importance of nonlinear simulations a contrast with a
linear simulation is shown in Video 1, notice the faster speed of
propagation and sharp focusing of shock waves in the nonlinear waves which
is absent in the linear case.